

Tracking nature: how scientists measure biodiversity trends
With millions of species on the planet, and countless populations, it would be an impossible task to measure everything, everywhere, all the time. So, scientists rely on global biodiversity indicators to help them understand how biodiversity – the variety of life on Earth – changes over time. Yet indicators depend on limited data, collected unevenly across the world, introducing uncertainty. Daudi Sumba, Chief Conservation Officer at WWF explains how scientists overcome these challenges, and why indicators like The Living Planet Index are essential to tracking life on a changing planet.
Why we need to measure biodiversity changeBiodiversity underpins our societies by providing fresh water, clean air, food, medicine, and materials that support billions of people’s livelihoods and wellbeing worldwide. It is this variety of life, from bacteria to seagrass to whales, that keeps our ecosystems resilient and providing the many benefits to humanity. So, it’s important that scientists have a way of measuring biodiversity health over time, to identify major threats and focus conservation efforts where they are most needed.
Recognising this, governments around the world have committed to halting and starting to reverse nature loss by 2030 under the Global Biodiversity Framework of the Convention on Biological Diversity. Measuring progress towards this goal depends on being able to track trends in the natural world as accurately – and transparently – as possible. Measuring biodiversity, however, is much harder than it might sound.
Many species are difficult to detect, rare, or live in inaccessible areas so researchers use a mix of field methods, remote monitoring and statistical models to monitor wildlife.
-
Direct counts – with animals observed on the ground, often using methods like transects to estimate abundance across wider areas.
-
Camera traps help to identify individual animals such as tigers based on stripe patterns. Because not every animal is photographed, models can help to estimate the total population size.
-
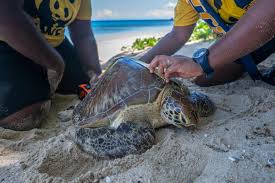
Proxy measures are sometimes used. For example, orangutan, sea turtle and gorilla populations can be estimated by counting their nests or scat.
-
Emerging technologies – including citizen scientists counting walrus from satellite imagery and AI-assisted analysis – are expanding what can be measured.
Even with these varied and advanced techniques, only a fraction of global biodiversity is monitored.
How much does science know about species globally?Knowledge about species is shaped by what is studied where, when, and how. As a result, monitoring data isn’t evenly distributed. A study in 2017, for example, found that biodiversity research is biased towards vertebrate species and temperate regions. Both ecological studies and their authors were found more likely to be based in higher income countries. Even large biodiversity data banks rely heavily on English-language published research, despite data being available in many other widely spoken languages.
As a result, science’s understanding of biodiversity can be patchy. For example, 15% of the species on the IUCN Red List of Threatened Species are listed as ‘Data Deficient’, meaning there isn’t enough data to assess their extinction risk. Yet, researchers have estimated more than half of these are likely to be threatened with extinction. This has real world conservation implications, as these species are often not prioritised for conservation.
Biodiversity indicators are used to summarise large amounts of information into metrics that make it easier to track trends over time. So, it’s important to keep in mind that indicators are signals based on available evidence, not complete inventories of life on Earth. There are many different indicators which look at different aspects of biodiversity.
-
Extinction risk – the likelihood that a species will become extinct soon
-
Biodiversity intactness – how today’s ecosystems compare with their natural, undisturbed state in terms of diversity and abundance of the species that live there
-
Abundance – how many individuals of a particular species are present in a specific area, regardless of how many different species there are
The Living Planet Report presents a set of widely used indicators focusing on different aspects of biodiversity:
-
The Red List Index tracks global trends in species’ survival.
-
The Biodiversity Intactness Index estimates how ecosystems have changed from their original condition.
-
The Living Planet Index measures average changes in the abundance of vertebrate species populations over time.
Global indicators all have an important role to play in communicating what science shows when it comes to changes in nature. Critically, despite measuring different aspects of global biodiversity change, they all indicate the same downward trend.
No single indicator captures every dimension of biodiversity change. The Living Planet Report therefore brings together multiple complementary indicators, each measuring different aspects of biodiversity, to provide a more complete picture of global trends.
Scientific debate around biodiversity indicators should be expected and is an important part of strengthening methods over time. These discussions have informed continued methodological testing and refinement but do not alter the broader scientific consensus that biodiversity is under significant pressure globally.
In the 2024 Living Planet Report for example, the Living Planet Index – produced by ZSL – indicates that monitored vertebrate wildlife populations declined by an average of 73% between 1970 and 2020. By taking an average change of all the populations, the index can reflect a broad picture of ecosystem health. It also helps to discount any very abundant species from dominating the trends or the index under-representing rare species that are less abundant.
Monitoring abundance change in this way is important, as changes in populations can be detected early on, even before other metrics begin to flag serious changes in the ecosystem. Although, because of the time-lag in data being published, abundance indicators struggle to reflect real-time changes.
The rates at which populations are increasing or decreasing can also be very different. Though the overall global Living Planet Index trend is negative, this doesn’t mean that all populations included in the index are in decline. For example, in the 2024 Living Planet Report, half are either stable or increasing, and half are in decreasing in size. This is because despite the number of positive and negative trends being more or less equal, the magnitude of the declining trends exceeds that of the increasing trends.
Whilst the Living Planet Index is primarily communicated through a single headline result, which is helpful for summarising change, its findings can still be misunderstood. For example, the global index has sometimes been misreported as the total number of animals or species lost. But, in fact, it means that the size of monitored vertebrate wildlife populations has declined, by 73% on average (as explained in the video below from 2022). This kind of aggregation used in the index inevitably simplifies a complex reality as local and regional patterns may differ. Yet it also serves an important purpose. By aggregating trends across thousands of monitored populations, the index provides a broad global signal of ecosystem change.
Bias and uncertainty, however, are an unavoidable feature of studying complex systems. Scientists therefore must consider these when they’re looking at measuring biodiversity.
Key sources of bias and uncertainty in abundance data include:
-
Uneven data coverage across time, regions and species groups
-
Short time series for some populations
-
Different methods used in underlying studies
-
Natural differences in population size
-
How hard to detect a species is
The Living Planet Index trends are calculated based on an ever-growing dataset. In 2024, the index comprised 34,836 population trends for 5,494 species. However, the data is biased towards well-monitored species and regions. Data availability for wildlife populations also varies over time. This is why the Living Planet Index uses 1970 as a global baseline because reliable, comparable data becomes scarce further back in time. In Europe and North America for example, many biodiversity declines occurred before 1970, meaning stable trends today may reflect already-depleted ecosystems rather than healthy ones. In fact, it’s possible that the report underestimates the full extent of human-driven declines in these regions.
How does the Living Planet Index account for gaps in wildlife data?One way to address regional biases is by continuing to add data – particularly from underrepresented groups – to refine and strengthen the index. In 2024, 265 species and 3,015 populations were added compared to the previous edition of the report, increasing the number of African populations by 45%.
Still, it can take many years for new data to become available before it can enter the Living Planet Database. Scientists still need ways to account for the differences in data availability when calculating the index, so often use a process called ‘weighting’. This helps to ensure the regional data is reflected more appropriately. In the Living Planet Index, regions and species groups where higher numbers of species are found, receive more weight. This isn’t a perfect solution but means that tropical regions for example, often contribute more to the global index than those from temperate regions. It’s designed to reduce bias rather than eliminate uncertainty entirely.
Data collected over short time periods or populations which have limited data can also add uncertainty. One option is to remove these, but removing imperfect data has drawbacks. It can make results less representative, by excluding parts of the world where monitoring is already sparse and smaller datasets are more common. For example, in tropical areas where funding may be less secure or monitoring has only just begun.
Of course, taking subsets or cuts of the whole database, or applying different weighting approaches, can produce different results. But the approach taken with the Living Planet Index is to use as much data as possible and to combine this with regular testing; showing the effect of removing portions of data. These tests are publicly available in the technical supplements of the Living Planet Report.
Measuring biodiversity change at a global scale is inherently complex, and no single metric can capture the full picture. The Living Planet Index is made up of local and regional studies that document recoveries as well as declines. From mountain gorillas to green turtles to European bison, there are clear examples of conservation working and populations rebounding. Where sustained conservation efforts are in place, alongside policy and community engagement, recovery is possible.
For almost 30 years, the Living Planet Report has been a powerful policy and advocacy tool. Since its first publication in 1998, the Living Planet Index has been cited over 2,000 times across peer-reviewed science and policy publications. It is also listed as an indicator in the monitoring of the Global Biodiversity Framework, while its methods are peer-reviewed, published and regularly improved upon.
Uncertainty means that scientists need to be clear about the limits of the data, testing how sensitive the results might be to certain assumptions, and improving the methods as better evidence becomes available. Different approaches may shift the magnitude of estimates, but the broader evidence from multiple indicators point to the same conclusion: nature is under sustained pressure worldwide.
We don’t need to measure everything, everywhere to know we need to act. The science is clear, and global indicators help us track whether the actions taken are strong enough to move us towards greater stability or deeper risk. The challenge now is less about understanding whether biodiversity is declining – and more about how quickly and effectively knowledge can be translated into actions that enable its rapid recovery.
( Press Release Image: https://photos.webwire.com/prmedia/6/359055/359055-1.jpg )
WebWireID359055
This news content was configured by WebWire editorial staff. Linking is permitted.
News Release Distribution and Press Release Distribution Services Provided by WebWire.