SO2 emissions fall in India as coal use slows Greenpeace global ranking
Indias toxic sulfur dioxide (SO2) emissions fell in 2019 for the first time in four years as coal use decreased, reveals a new analysis of NASA satellite data by Greenpeace India and the Centre for Research on Energy and Clean Air (CREA). In 2019, human-made SO2 emissions fell in all three of the worlds top SO2 emitter countries India, Russia and China the report shows.
In India were getting a glimpse of what reduced coal use means for air quality and health. In 2019, renewable energy capacity expanded, coal generation decreased, and we saw a corresponding improvement in air quality. But our air is still far, far from safe. We must speed up the energy transition away from coal and toward renewables, for our health and the economy, said Avinash Chanchal, campaigner at Greenpeace India.
The report ranks the worlds biggest emitters of sulfur dioxide, a poisonous air pollutant that increases risk of stroke, heart disease, lung cancer and premature death. [1] [2]
Key findings, based on analysis of NASA satellite data:
- In 2019, India emitted 21% of global anthropogenic (human-made) SO2 emissions, nearly twice that of second ranked global emitter, Russia.
- Anthropogenic SO2 emissions fell by approximately 6% worldwide in 2019. For only the second time on record, anthropogenic SO2 emissions decreased in all of the top three emitter countries: India, Russia and China.
- In 2019, Chinas anthropogenic SO2 emissions fell by 5%, the slowest rate of decrease in the past decade. While China was once the worlds biggest emitter of SO2, its emissions have plummeted by 87% since 2011, in large part due to strengthened emissions standards and the use of scrubbers at power plants.
- South Africa saw a sharp decrease in SO2 emissions in 2019, bringing the countrys emissions to their lowest level on record. The fall resulted in large part from a temporary reduction in coal-fired power generation, which led to rolling blackouts.
- Anthropogenic SO2 emissions rose 14% in Turkey in 2019, marking the fourth consecutive year of increase. Between 2015 and 2019, Turkeys share of coal-based electricity production increased by nearly 10%. During this period SO2 emissions doubled.
- In Mexico anthropogenic SO2 emissions rebounded by 4% in 2019 after a rapid three-year decline. Oil and gas combustion, responsible for 90% of Mexicos anthropogenic SO2 emissions, increased in 2019.
- In 2019, the Norilsk smelter site in Russia was the biggest source of anthropogenic SO2 emissions in the world. The Rabigh region, an oil and gas-based SO2 emission hotspot in Saudi Arabia, ranked No. 2.
- The Suralaya coal cluster in Banten, Indonesia was the largest SO2 hotspot in Southeast Asia in 2019, followed closely by Singapores oil and gas refineries.
These emissions tracked by satellites are affecting the health of millions of people, many who have had their lives cut short or their health compromised, showing the urgency of implementing stronger emissions regulations and transitioning to clean energy sources. Unfortunately, in some countries topping the list, like India, Mexico and South Africa, governments have continued to delay or weaken the implementation of emissions norms, even as the COVID-19 pandemic should have driven home the importance of respiratory health, said Lauri Myllyvirta, lead analyst at the Centre for Research on Energy and Clean Air (CREA).
Governments must immediately halt investment in fossil fuels and shift to safer energy sources, such as wind and solar. At the same time, they must strengthen emissions standards and require the application of flue gas pollution control technology
at power plants, smelters and other industrial SO2 emitters.
Notes:
Report available here.
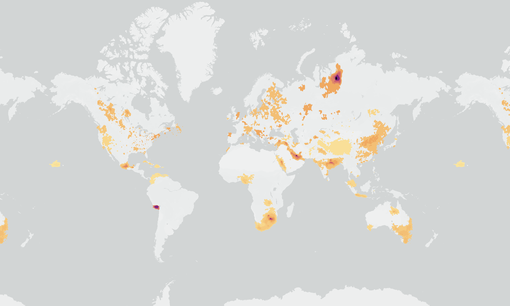
An interactive map of SO2 hotspots is available here.
Figure 1. (below) The worlds 12 largest emitters of toxic SO2 in 2019
[1] For information on the health impacts of sulfur dioxide see Yang et al., 2014 ; Shah et al., 2015 ; Lin et al., 2018 ; Mandel et al., 2015
[2] Researchers used NASA satellite data and a global catalogue of SO2 emission sources to detect emission hotspots. NASAs satellite technology provides near worldwide estimates of SO2 emissions. Researchers analysed the data to identify source industries and emission trends. NASA estimates that the MEaSUREs catalogue, which is the main source for this report, accounts for about half of all known anthropogenic SO2 emissions worldwide.
( Press Release Image: https://photos.webwire.com/prmedia/7/264942/264942-1.png )
WebWireID264942
This news content was configured by WebWire editorial staff. Linking is permitted.
News Release Distribution and Press Release Distribution Services Provided by WebWire.